How to Choose TFT Resolution for an Industrial HMI
Moving a familiar HMI from 800 × 480 to 1280 × 800 can make the text look sharper and the buttons harder to use. Both can happen at once. If the software keeps the same pixel dimensions, each control becomes physically smaller on a screen of similar size.
Choose industrial HMI display resolution by working backward from the operator’s tasks. Establish the physical size of important text and controls, reserve space for persistent status information, and then check whether the processor can render the result. Resolution belongs in that chain; it does not replace it.
Start with a full-size screen layout
Draw the busiest normal operating page at its intended physical size. Include units, alarm status, mode selection, and navigation. Use realistic values: a negative reading, the longest translated label, and a fault message that is more than two words long.
Test the layout from the working position. A technician sitting at a bench and an operator standing beside a guarded machine do not have the same viewing distance. Neither does a maintenance engineer looking over someone else’s shoulder.
Do not approve a layout only on a large development monitor. Print it at actual size or run it on the target panel. If operators have to move closer to read routine information, first reconsider the hierarchy and physical text size. Adding pixels will not enlarge the text unless the layout changes too.
Pixel density gives the conversion you need
For a panel with square pixels, pixel density is approximately:
PPI = sqrt(horizontal pixels² + vertical pixels²) / diagonal in inches
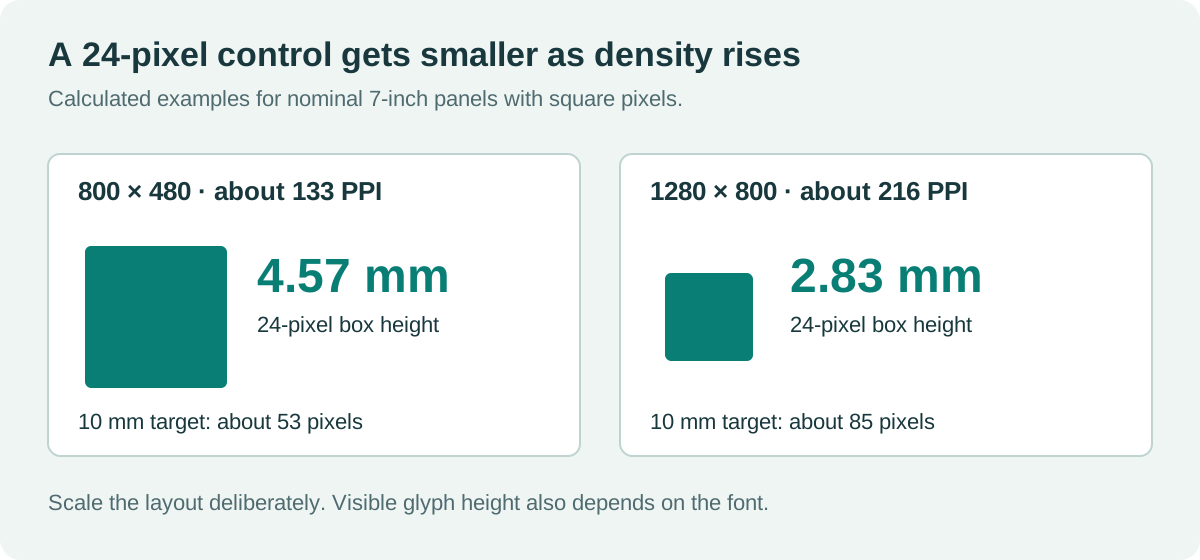
Physical pixel pitch is 25.4 / PPI millimeters. Multiply that pitch by a control’s pixel dimensions to estimate its physical size. Use the manufacturer’s active-area drawing for the final design; the advertised diagonal may be rounded.
| Nominal 7-inch panel | Approximate density | Pixel pitch | Physical height of a 24-pixel box | Pixels for a 10 mm target |
|---|---|---|---|---|
| 800 × 480 | 133 PPI | 0.191 mm | 4.57 mm | 53 px |
| 1024 × 600 | 170 PPI | 0.150 mm | 3.60 mm | 67 px |
| 1280 × 800 | 216 PPI | 0.118 mm | 2.83 mm | 85 px |
These are calculated examples, not recommended minimum sizes. A 24-pixel font setting is also not necessarily a 24-pixel visible character: font metrics, ascenders, and line spacing change the actual glyph height. Measure the rendered text rather than relying on its style-sheet value.
The three panels have slightly different aspect ratios. Their physical widths and heights therefore differ even when each is sold as 7 inches. Check the active area before reusing a bezel or touch layout.
Allocate the useful area before selecting the panel
A nominal 800 × 480 image does not provide 480 rows for a trend chart. Alarm banners, navigation, headings, and status bars consume space. Work out the plot or data-entry area that remains after those elements are included.
For example, reserving 56 rows at the top and 64 at the bottom leaves 360 rows. That can be sufficient for a simple process page, but a table with many editable rows may require pagination. A higher resolution helps when the physical screen is large enough to keep the text comfortable.
For a compact operator station, compare the available layouts on a 7-inch industrial HMI display. If the task genuinely needs a larger working area, a 10.1-inch TFT operator panel may solve the problem more directly than increasing pixel density on the smaller panel.
Touch targets belong in millimeters as well as pixels
Record the physical target size, spacing, and usable touch area. A visible button and its active hit region can differ, but invisible overlap between adjacent controls creates ambiguity. Test corner controls near the bezel, where finger placement is least forgiving.
The W3C’s minimum target-size guidance is useful for understanding target separation, but its CSS-pixel rules address web content. They are not a physical-size specification for a gloved industrial operator. Translate the interface into actual dimensions and evaluate the intended gloves and posture.
Likewise, WCAG text contrast guidance can inform foreground and background choices. A compliant color pair in software does not establish readability under reflections or through tinted glass. Test the final optical stack in the installation lighting.
Count the memory cost before the layout is frozen
Resolution changes both storage and the work required to redraw the screen. The following values assume tightly packed buffers without alignment padding. MiB means 1,048,576 bytes.
| Resolution | One RGB565 buffer | Two RGB565 buffers | One ARGB8888 buffer |
|---|---|---|---|
| 800 × 480 | 0.732 MiB | 1.465 MiB | 1.465 MiB |
| 1024 × 600 | 1.172 MiB | 2.344 MiB | 2.344 MiB |
| 1280 × 800 | 1.953 MiB | 3.906 MiB | 3.906 MiB |
Those numbers exclude fonts, image assets, drawing buffers, stacks, and the rest of the application. Moving from 800 × 480 to 1280 × 800 increases the pixel count by about 2.67 times. The actual performance change depends on how much of the screen is redrawn, the graphics engine, and the memory system.
Use a proper TFT framebuffer bandwidth calculation before committing to the processor. A simple static dashboard and a translucent animated interface can place very different loads on the same panel.
Check the native timing and the rendering mode
The display interface needs to carry the selected mode at the panel’s specified timing. Active pixels alone do not define the pixel clock; horizontal and vertical blanking also matter. Check the exact timing table rather than substituting a nearby resolution from another panel.
Rendering architecture matters too. A panel controller with its own display memory can accept partial updates, while a continuously scanned RGB panel still needs a complete valid image somewhere in the system. LVGL’s display-interface documentation distinguishes partial, direct, and full rendering modes. Match the software mode to the actual hardware path.
Keep the display at native resolution where practical. Scaling a low-resolution UI to a higher-resolution panel can soften text or produce uneven line weights. If scaling is required, inspect thin traces, small numerals, and icon edges on the physical panel.
A useful prototype test has awkward content
Build one page that combines the largest expected alarm banner, the longest label, several live values, and an active trend. Change values while opening a menu and writing a log file. Watch response time as well as appearance.
Then test the page with intended users at the real distance. Ask them to distinguish similar digits, identify the active mode, and edit a value without touching its neighbor. Include the least favorable viewing angle and the actual cover glass. These checks often reveal whether the problem is pixel count, physical size, contrast, or layout density.
Keep the result in the design record: panel active area, resolution, font metrics, control dimensions, viewing position, and measured frame timing. That gives the next engineer enough information to maintain the interface when a panel changes.
Does a higher resolution make an HMI better?
It can improve fine text, diagrams, and the amount of information available. It helps only when the layout preserves readable physical dimensions and the hardware has enough performance. A well-spaced 800 × 480 interface can be easier to operate than a crowded 1280 × 800 screen of the same size.
Sources and photograph
Sources are linked in the relevant sections. All dimensional and memory examples are calculated from the stated assumptions; they are not panel measurements.
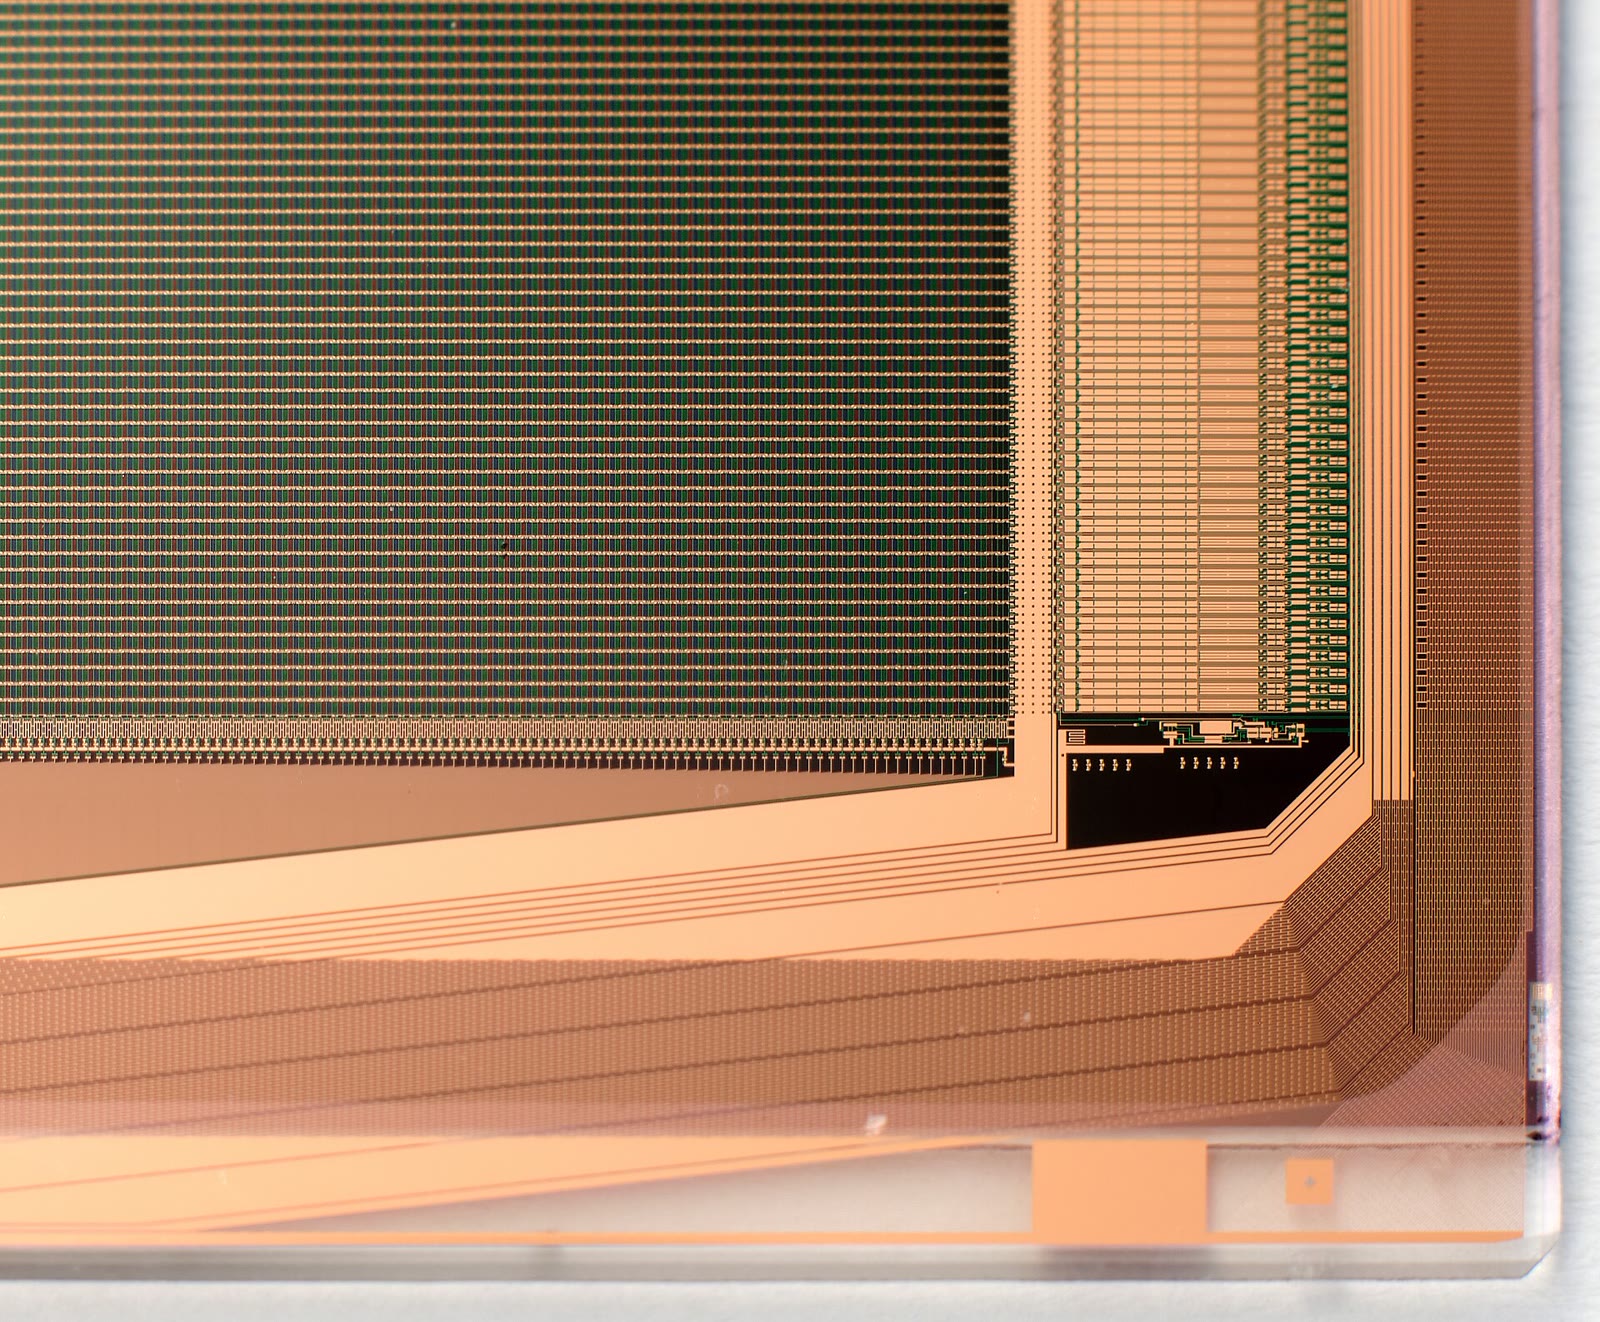
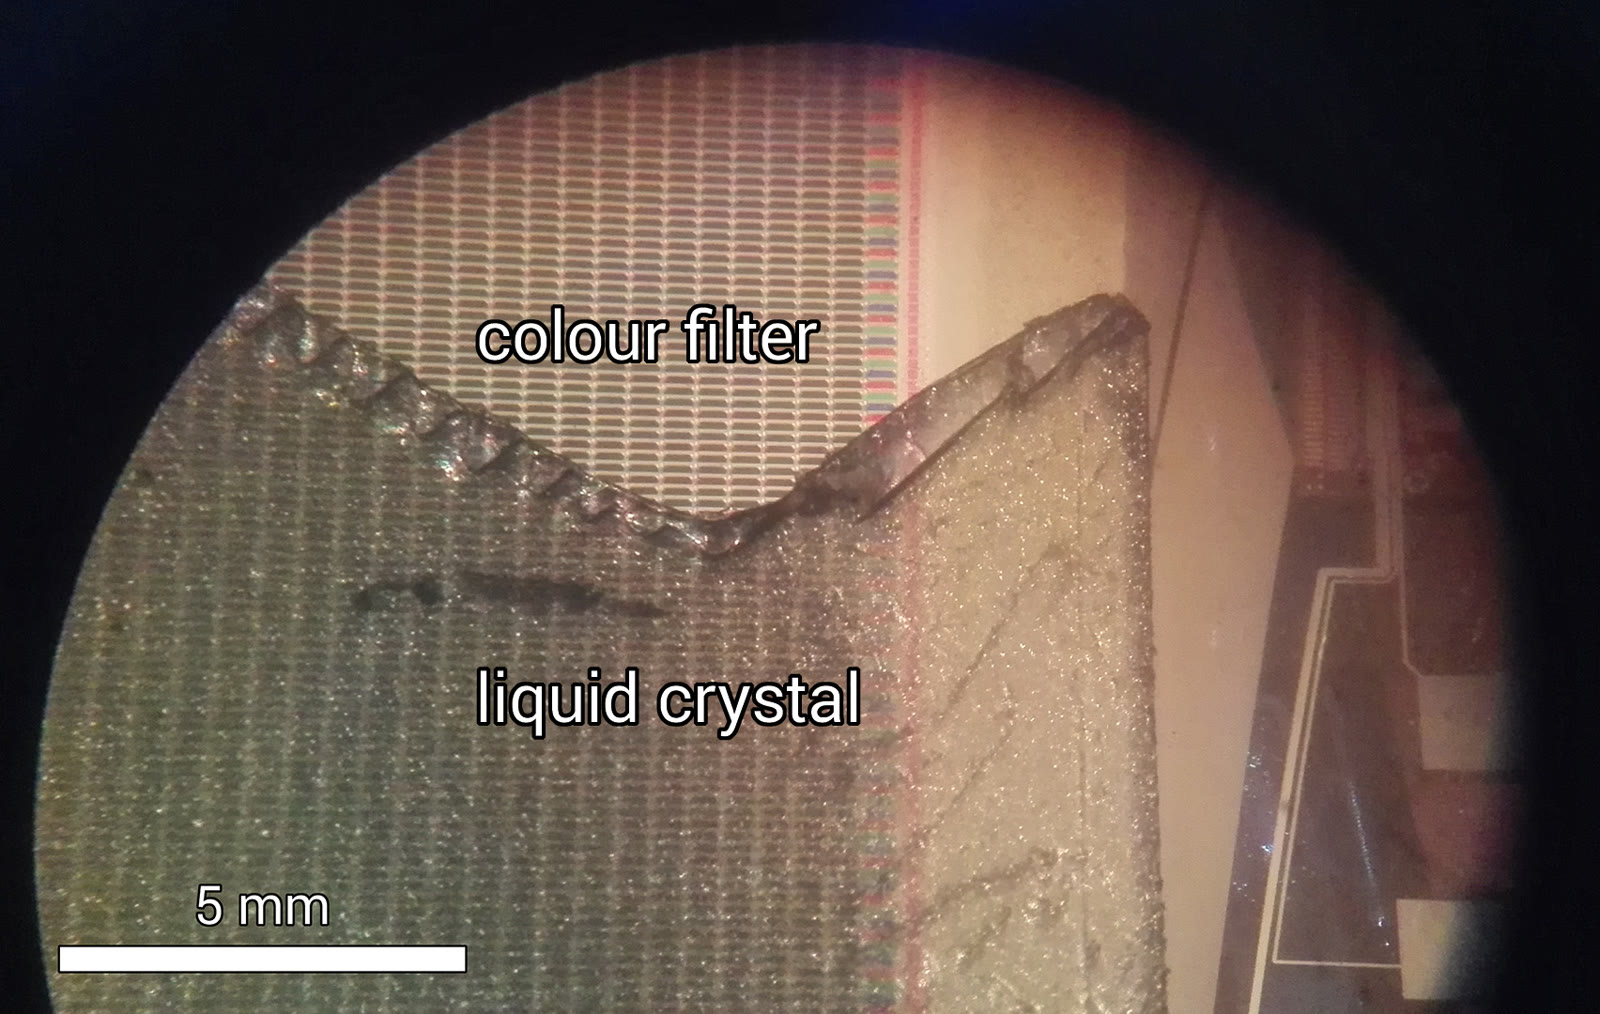
Hero photograph: Sdk16420, LCD display under an optical microscope, CC BY-SA 4.0. Resized and JPEG-compressed; this adapted photograph remains under CC BY-SA 4.0. The physical-size diagram is an original illustration.