How to Calculate MIPI DSI Lane Count and Data Rate
Dividing pixel throughput by four gives a useful first estimate for a four-lane MIPI DSI link. It does not complete the design. Blanking policy, packet overhead, operating mode, clock limits, and the panel’s supported configuration determine whether the resulting rate is usable.
Start with the exact host and panel combination. A processor may expose four physical data lanes while a panel accepts only two. A bridge can add another set of timing and rate constraints. The usable configuration is the intersection of those limits.
Collect the mode before calculating
Record active width and height, refresh rate, pixel format on the link, horizontal and vertical timing totals, lane count options, and the permitted lane-rate range. Note whether the mode is video or command mode.
The MIPI DSI overview establishes the interface family, but implementation decisions require the actual host and peripheral documentation. DSI and CSI are different interfaces even when connectors or physical-layer terminology look familiar.
| Input | Example value | Why it matters |
|---|---|---|
| Active image | 800 × 480 | Defines visible payload |
| Refresh rate | 60 Hz | Defines payload repetition |
| Link format | RGB888, 24 bits/pixel | Determines transmitted pixel bits |
| Timing totals | 1056 × 525 | Defines the illustrative pixel clock |
| Data lanes | 2 or 4 | Shares high-speed payload |
| Video mode | Host/panel-specific | Changes packet and timing behavior |
These example timings are for calculation only. Do not substitute them for a panel’s approved timing table.
Calculate the active-image lower bound
For uncompressed pixels, the active payload is:
active bits/s = active width × active height × refresh × link bits/pixel
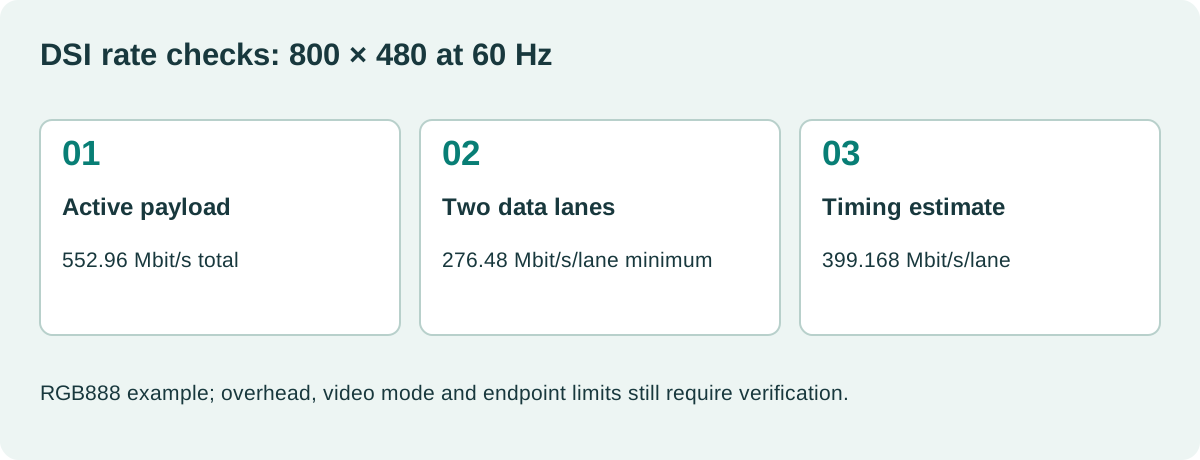
The example gives 800 × 480 × 60 × 24 = 552.96 Mbit/s. With two lanes, the average active payload is 276.48 Mbit/s per lane. With four lanes, it is 138.24 Mbit/s per lane.
Those values exclude protocol overhead and the time consumed by other required activity. They are lower bounds, not lane-rate settings.
| Example configuration | Two lanes | Four lanes |
|---|---|---|
| Active-image lower bound | 276.48 Mbit/s/lane | 138.24 Mbit/s/lane |
| Pixel-clock-based estimate | 399.168 Mbit/s/lane | 199.584 Mbit/s/lane |
The second row uses the timing-total calculation described below. Its role is to provide a different planning check, not a universal DSI formula.
Include the actual timing structure
The illustrative pixel clock is 1056 × 525 × 60 = 33.264 MHz. Multiplying by 24 bits and dividing by the lane count gives the second row of the table.
Whether that estimate matches the configured transport depends on how the host handles blanking and packets. Burst video can transmit active pixels during a shorter high-speed interval. Non-burst modes organize the line differently. Required transitions and packet overhead still consume time.
ST’s DSI host application note describes supported host operation. Use the relevant device’s timing method and validate the peripheral’s requirements, rather than adding an arbitrary percentage and calling the result complete.
Check both minimum and maximum rates
A link can be too slow for the payload and too fast for the panel. It can also fall outside a supported PLL or lane-rate range even when the arithmetic appears comfortable.
Check achievable clock settings and their rounding. The configured rate may differ from the requested value because the host derives it from discrete divider combinations. Verify the actual setting reported by the driver or measured appropriately.
Do not confuse D-PHY high-speed clock frequency with data rate. DDR signaling transfers on both clock edges, so a value labeled clock can differ by a factor of two from a value labeled lane bitrate. Check each register and tool’s units.
Keep lane count consistent across the host, initialization, board routing, bridge, and panel. Unused lanes need the handling specified by the involved devices.
Pixel storage format is not link format
An RGB565 framebuffer can feed a controller that emits RGB888. In that case, the memory budget uses two stored bytes per pixel while the link calculation uses the transmitted format.
Conversely, a graphics library may use four-byte pixels even though the panel receives 24-bit color. Avoid taking a memory allocation constant and treating it as the link’s bits-per-pixel value.
Our embedded TFT memory bandwidth guide treats scanout and rendering separately. Both the memory path and DSI link have to work; spare lane bandwidth cannot fix a starved display FIFO.
Compression requires another explicit assumption. Only use a reduced effective payload when the entire path supports and enables the relevant compression mode. A feature in a specification family is not proof that the selected host and panel implement it.
A bridge adds independent constraints
For example, the TI SN65DSI83 data sheet defines supported input lanes, link formats, and output timing for a DSI-to-LVDS bridge. Its limits must be checked alongside the host and LCD.
A bridge’s internal buffering can affect which burst or clock relationships are allowed. Do not assume it absorbs any difference between input packet timing and output scan timing.
Record the chosen reference clock, PLL settings, lane count, input format, output mapping, and panel totals as one configuration. Keep a known-good register dump with the firmware revision.
Validate a simple pattern before the full UI
Start with stable color bars or a checkerboard at the required native mode. Check edges, fine lines, colors, and repeated startup. Then enable the intended graphics workload.
Watch for driver errors, FIFO underruns, bridge status flags, and failures during transitions between low-power and high-speed states. Some faults appear only after sleep or warm restart.
The MIPI DSI bring-up sequence and LCD black-screen isolation workflows help separate rate problems from power, reset, mapping, and initialization faults.
Change one parameter at a time and retain the failing configuration. A working picture after several simultaneous edits is weak evidence about which limit was responsible.
What belongs in a lane calculation sheet?
Include the source timing table, active payload calculation, selected transport mode, overhead method, achievable clock settings, all endpoint limits, and the tested result. Label calculated lower bounds clearly.
That sheet should let another engineer reproduce both the arithmetic and the configuration. It also makes a future panel change reviewable: a replacement with the same active resolution may require different blanking, initialization, or lane-rate settings.
A practical handover detail
As a numerical cross-check, express every intermediate value with units. Keep MHz, Mbit/s per lane, aggregate Mbit/s, and bytes per second in separate columns. Recalculate after changing link format or refresh rate, even if resolution stays fixed. A calculation sheet should also show the requested rate and the rate actually selected by the clock-generation logic. That small distinction can explain why two nominally identical driver configurations behave differently on hosts with different reference clocks or divider options.
Sources and image credit
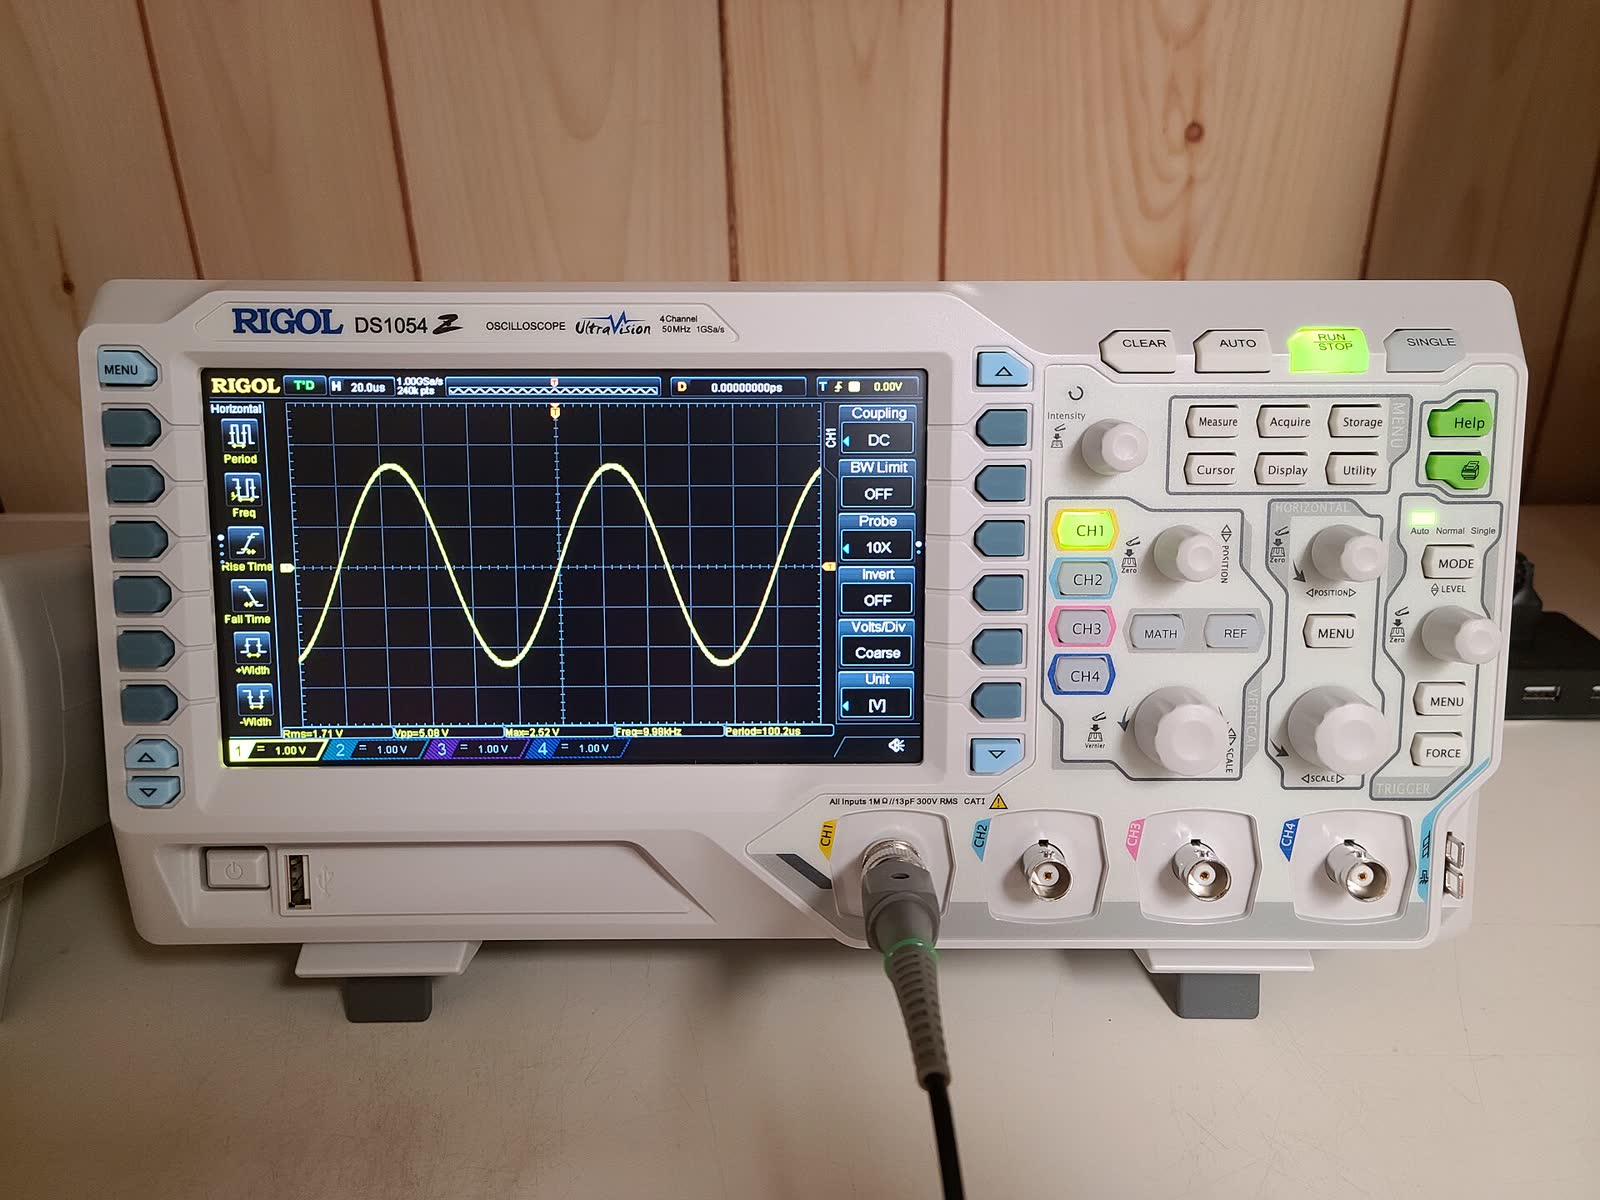
Primary technical references are linked beside the relevant claims. Numerical examples are calculations under the stated assumptions. The original diagram explains the design method; neither it nor the photograph represents a qualification test performed by this site.
Hero photograph: Draconichiaro, CC BY-SA 4.0. Resized and JPEG-compressed. This adapted photograph remains under the linked ShareAlike license.