TFT Displays for Test and Measurement Instruments
A measurement screen can look smooth while the underlying data is stale. It can also show a sharp trace that hides a short event because the rendering algorithm discarded the sample. For a test instrument, a good display must preserve the meaning of the measurement, not just make the interface attractive.
The main test measurement TFT display requirements are readable values and units, honest waveform presentation, responsive controls, and electrical integration that does not disturb the measurement path. Panel resolution and brightness support those requirements, but neither establishes instrument accuracy.
Separate the rates in the signal path
Acquisition sample rate, waveform capture rate, numerical measurement update rate, UI redraw rate, and panel refresh rate describe different events. Specify them separately and decide which the user needs to see.
Tektronix’s oscilloscope evaluation primer distinguishes sample rate from waveform capture rate and record length. The same separation is useful when designing an instrument’s front end and display pipeline. A 60 Hz LCD does not imply 60 measurements per second or limit the ADC to 60 samples per second.
| Rate or property | What it describes | Display-design implication |
|---|---|---|
| Acquisition sample rate | How frequently the input is sampled within a record | Preserve the acquired data for measurement and zoom |
| Waveform capture rate | How frequently records are acquired | Do not equate it with visible LCD frames |
| Measurement update rate | How often a derived numeric result changes | Show validity and update state consistently |
| UI redraw rate | How often graphics are regenerated | Balance response time with processing and memory load |
| Panel refresh rate | How often the panel receives or scans an image | Avoid tearing and inconsistent visual updates |
Use a timestamp or sequence identity internally to keep related values together. If the trace, cursor readout, and automatic measurement refer to different records, the interface can present a plausible but contradictory result.
Design the usable plot area, not just the panel
A 1024-pixel-wide screen does not provide 1024 columns for waveform data when menus and readouts occupy part of the width. Establish the actual plot rectangle and the space needed for channel labels, units, trigger state, and warnings.
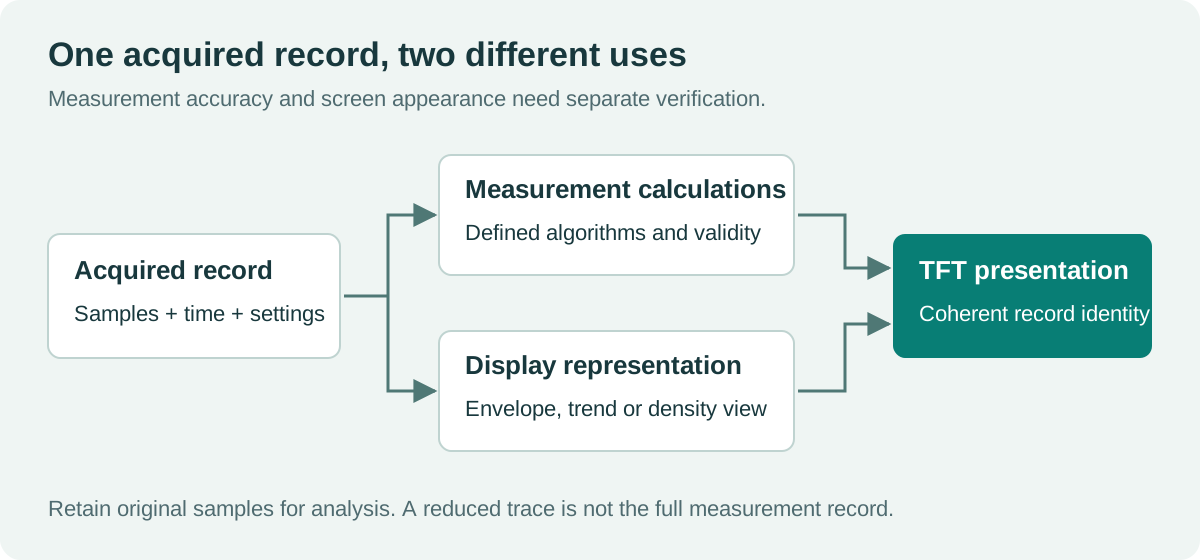
For example, a 720-column plot showing a 100,000-sample record maps roughly 139 samples into each column. Selecting just one sample per column can miss a narrow excursion. A min/max envelope can preserve visible extremes within each bin, although it does not preserve every timing detail or replace the original record.
Choose the reduction method for the task. An envelope view, an averaged trend, a density plot, and a decimated trace tell different stories. Label averaging, filtering, persistence, and peak-detect modes clearly. Retain access to the underlying data so zooming or measurement does not rely on the reduced display image.
Make held, invalid, and overloaded readings unmistakable
A held reading should not look live. A lost probe connection should not look like a valid zero. An overrange condition should not quietly retain the last in-range value without explanation.
Place units next to values, preserve sign and decimal-point visibility, and test the longest expected number. Include ranges and prefixes that are easy to confuse. If autoranging changes a prefix, coordinate that update with the numeric value rather than briefly showing a mismatched combination.
Use channel labels and line styles as well as color. Thin red and blue traces that look distinct on a desktop monitor may become difficult to separate at an angle or through a protective lens. Evaluate the final panel with the intended background, grid intensity, and brightness range.
The physical-size calculations in our industrial display resolution guide are useful here. More pixels can refine a trace, but smaller readouts are not an acceptable trade if the instrument must be read from across a bench.
Keep frequent adjustments tactile where useful
Touch is well suited to selecting a channel, moving a cursor, or opening a contextual menu. Knobs and dedicated keys often work better for repeated scale changes, start/stop actions, and adjustments made while watching the device under test.
Avoid placing a critical control where a resting hand can trigger it. Test touch near the edge of the bezel and while leads occupy the front panel. For portable instruments, include the actual gloves and one-handed grip. The PCAP and resistive touch tradeoffs depend on those physical tasks, not only on the desired appearance.
Measure the delay from user input to visible acknowledgment. The instrument can acknowledge a change promptly while a longer acquisition completes, provided it clearly shows that the displayed result still belongs to the previous settings. Silent latency encourages repeated input and accidental overshoot.
Budget graphics traffic alongside acquisition traffic
An acquisition DMA engine, CPU, storage interface, and display controller may compete for the same memory. A screen that is responsive when acquisition is stopped can stutter when deep records are being captured or exported.
Estimate scanout, redraw, image assets, waveform buffers, and data-copy traffic separately. Use the TFT framebuffer memory calculation to establish the graphics portion, then add the instrument workload. Check worst-case combinations such as acquisition plus file export plus an open measurement overlay.
Keep buffer ownership clear. The renderer should not read a record while the acquisition engine overwrites it unless that access pattern is explicitly synchronized. Likewise, a displayed trace and its numeric results should switch to a new record coherently.
Check whether the display contaminates the measurement
The backlight driver, switching supplies, display clocks, and digital return currents can couple into sensitive analog circuitry. The amount depends on the layout, shielding, grounding, supply architecture, and measurement bandwidth. Do not assume a quiet-looking screen is electrically quiet.
Run controlled comparisons with a known input or appropriate termination. Change brightness, backlight dimming mode if supported, image activity, touch scanning, and display refresh conditions one at a time. Save spectra or noise measurements with the same acquisition settings. A repeatable component that tracks one of those changes gives the hardware team a useful lead.
Investigate the coupling path before applying a software filter. A filter can hide a display-related spur while also removing real input content. Coordinate return paths and supply filtering with the analog design, then repeat the measurement on the final enclosure and cable arrangement.
Qualify the display with measurement scenarios
| Scenario | What the team should verify |
|---|---|
| Short pulse inside a long record | The selected rendering mode does not silently discard relevant evidence |
| Hold or stopped acquisition | State is obvious and readouts remain associated with the displayed record |
| Probe disconnect or overrange | Invalid conditions cannot be read as valid numeric results |
| Rapid range changes | Units, scaling and results remain coherent |
| Acquisition plus export | Controls remain usable and lost deadlines are detectable |
| Brightness sweep | No unacceptable measurement disturbance or unreadable dim setting |
| Off-axis and bright-light viewing | Traces, units and warnings remain distinguishable |
| Restart after interrupted save | Measurement state and saved-data status are unambiguous |
For a handheld product, add battery transitions, drop-related connector checks, and the intended outdoor conditions. A compact instrument TFT module has a different packaging and power budget from a bench instrument, even when both display the same measurement type.
What should be preserved for the next hardware revision?
Keep the approved fonts and physical dimensions, color and line-style rules, display timing, buffering scheme, waveform reduction method, and measurement-noise results. Record the exact panel, backlight driver, and touch firmware used. That evidence helps prevent a seemingly minor display substitution from changing either usability or the instrument’s electrical behavior.
Sources and photograph
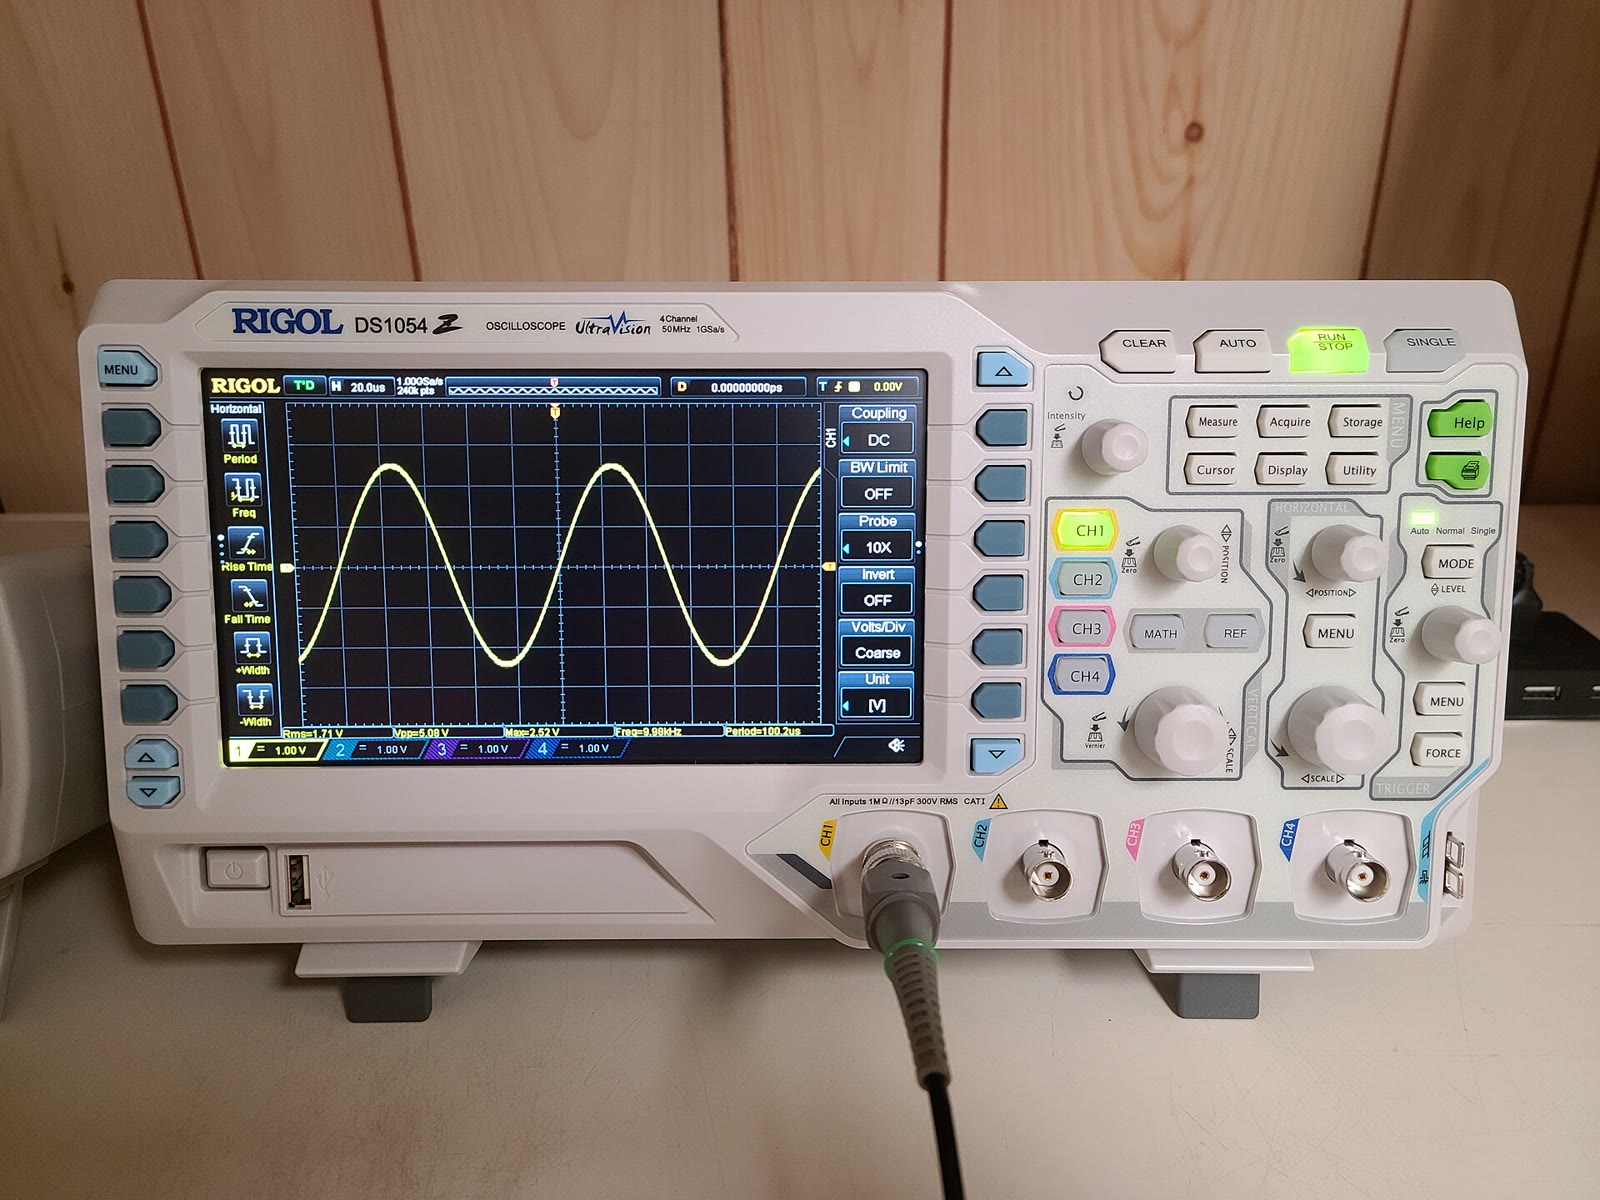
The Tektronix primer supports the acquisition terminology. The pixel-mapping example and validation workflow are engineering examples, not performance measurements of the pictured instrument.
Hero photograph: Draconichiaro, RIGOL DS1054Z oscilloscope, CC BY-SA 4.0. Resized and JPEG-compressed; the adapted photograph remains under CC BY-SA 4.0. The acquisition-to-display illustration is original.