Framebuffer Size and Memory Bandwidth for Embedded TFTs
A framebuffer can fit in RAM and still fail to feed the display reliably. Capacity answers how much image data the system can hold. Bandwidth answers how quickly that data can move while the CPU, graphics engine, storage, and other peripherals are also using memory.
Calculate both before selecting the processor. Then check the result on the actual board with competing traffic enabled. A screen that works with a stationary logo has passed a much easier test than a screen drawing trends while logging data.
This guide uses uncompressed RGB565 at two bytes per pixel and ARGB8888 at four bytes per pixel. It distinguishes average active-image traffic from the timing-dependent demands of a real display controller.
Start with storage, including stride
For a tightly packed image:
frame bytes = width × height × stored bytes per pixel
The more general expression is stride × height, where stride is the number of bytes between the beginnings of adjacent rows. Hardware or software may round each row up to an alignment boundary. Allocate the padded size, not merely the visible pixel count.
| Resolution | RGB565, one frame | RGB565, two frames | ARGB8888, two frames |
|---|---|---|---|
| 480 × 272 | 255 KiB | 510 KiB | 1,020 KiB |
| 800 × 480 | 750 KiB | 1,500 KiB | 3,000 KiB |
| 1024 × 600 | 1,200 KiB | 2,400 KiB | 4,800 KiB |
| 1280 × 800 | 2,000 KiB | 4,000 KiB | 8,000 KiB |
KiB means 1,024 bytes. These values exclude padding and all other application memory.
For a padding example, an 854-pixel RGB565 row contains 1,708 bytes. If the controller requires a 64-byte stride alignment, round that to 1,728 bytes. Across 480 rows, the allocation becomes 829,440 bytes instead of 819,840 bytes. The difference is small here, but a mismatched stride can produce a badly distorted image even when enough RAM exists.
Do not infer stored format from the panel interface. A 24-bit RGB output can be fed from a 16-bit framebuffer if the controller supports conversion. Conversely, an operating system may store 24-bit color in a four-byte pixel format. Inspect the configured memory format.
Separate scanout from redraw traffic
For one fully visible, uncompressed layer, a useful lower-bound average is:
active-image scanout bytes/s = width × height × bytes per pixel × refresh rate
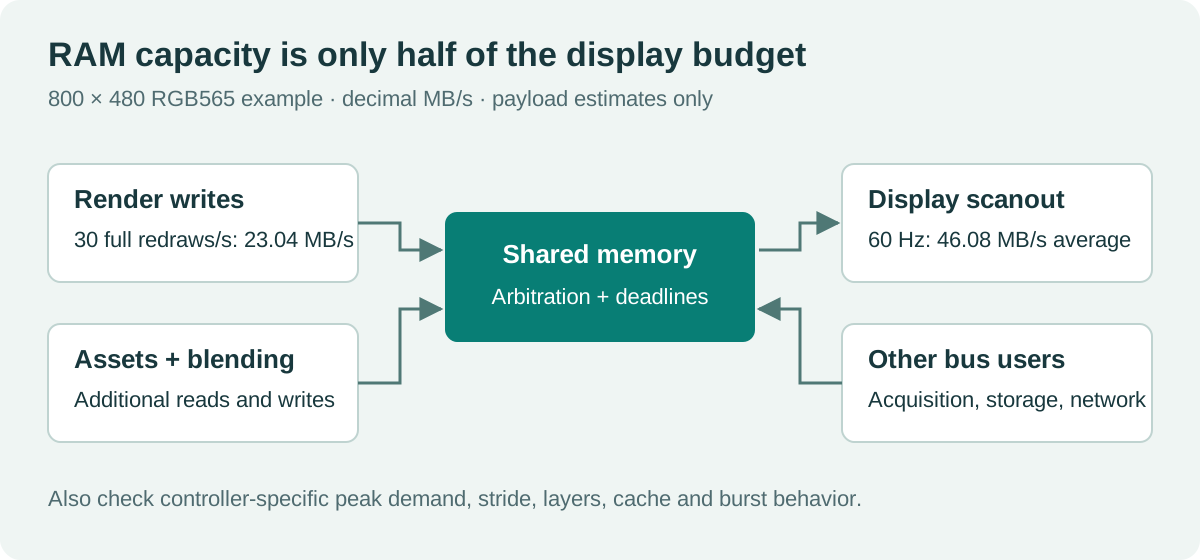
An 800 × 480 RGB565 image at 60 Hz produces 46.08 MB/s of active pixel reads. MB/s here means decimal millions of bytes per second. That is not a safe memory-system rating; it is the image payload before contention, burst behavior, and controller-specific requirements are considered.
| One full-screen layer at 60 Hz | RGB565 active-image reads | ARGB8888 active-image reads |
|---|---|---|
| 800 × 480 | 46.08 MB/s | 92.16 MB/s |
| 1024 × 600 | 73.73 MB/s | 147.46 MB/s |
| 1280 × 800 | 122.88 MB/s | 245.76 MB/s |
Drawing adds traffic. If a CPU writes the entire 800 × 480 RGB565 back buffer 30 times per second, those writes add 23.04 MB/s. Scanout plus those writes is already 69.12 MB/s, before reading assets, blending, cache writebacks, or copying buffers.
A full-frame memory copy performs both a read and a write. A blend may read several source images and write a destination. Hardware acceleration reduces CPU work, but the memory transactions still need a budget.
Why the pixel clock changes the check
The panel scans active pixels within a timing structure that includes blanking. For a timing-driven interface:
pixel clock = horizontal total × vertical total × refresh rate
As an illustrative timing set, totals of 1,056 × 525 at 60 Hz give 33.264 MHz. The active image could still be 800 × 480. These totals are an example, not a timing recommendation for every 800 × 480 panel.
ST’s AN4861 display-controller application note uses pixel clock and layer byte depth in its LTDC bandwidth checks. With the example clock and one RGB565 layer, that check gives 66.528 MB/s. It addresses a different constraint from the 46.08 MB/s average active-image payload. Follow the specific controller’s method rather than treating the smaller number as a sufficient design target.
The industrial TFT interface selection decision also affects where the framebuffer lives and how updates travel. A command-mode display with internal RAM is not the same system as a raw RGB panel continuously scanned from external SDRAM.
Double buffering changes ownership, not pixel count
With two full-screen buffers, scanout reads one while rendering updates the other. The display normally reads only the front buffer, so merely allocating a second buffer does not double scanout bandwidth. Additional redraws, synchronization copies, or layers can increase traffic.
Swap buffers at the controller’s supported synchronization point. If the new address takes effect halfway through a frame, the top and bottom may come from different images. Also ensure that the rendering operation has completed before making its buffer visible.
LVGL’s rendering-mode documentation explains how partial, direct, and full rendering use buffers differently. Small drawing buffers can reduce working RAM, but they do not eliminate a raw panel’s need for a complete scanout image. Identify every buffer and who owns it at each stage.
Cache errors can look like bandwidth problems
On systems without hardware coherency between CPU caches and display DMA, the CPU can update cached pixels while the display reads old external-memory contents. A frozen rectangle or intermittent old image may therefore be a visibility problem rather than a slow bus.
Follow the processor’s cache and memory-attribute rules. Clean CPU-written cache lines before a noncoherent DMA engine reads them. Handle DMA-written data and invalidation with equal care, including cache-line alignment and ordering. Avoid placing unrelated live data in cache lines that a display routine invalidates.
Do not fix the symptom by scattering cache operations through the drawing code. Define ownership transitions around rendering, DMA completion, and buffer swaps. For a first diagnostic, a correctly configured non-cacheable test buffer can help isolate coherency from throughput; its performance is not representative of the final design.
Measure the board under the intended workload
Use a demanding page: scrolling text, a moving trend, an overlay, and the largest image transition. Run the storage, networking, and sensor tasks at their intended rates. Log display underrun flags, render duration, buffer-swap timing, and missed deadlines.
Test the slowest permitted memory configuration and relevant temperature conditions. A headline SDRAM transfer rate is not sustained application bandwidth. Refresh overhead, bank conflicts, access patterns, and other bus masters all affect the available service time.
If the system runs out of margin, first identify the traffic source. Reducing unnecessary full-screen redraws can be more effective than lowering refresh rate. Other options include simpler layer composition, a lower stored color depth, improved placement or alignment, and a wider or faster supported memory interface. Change one variable at a time.
The HMI resolution and pixel-density calculation helps quantify the cost of a panel upgrade. If symptoms appear only after the interface becomes active, use the embedded LCD black-screen checks to separate scanout faults from power and initialization issues.
What belongs in the design record?
Save the visible resolution, panel timing totals, pixel clock, stored formats, strides, buffer count, layer count, and redraw assumptions. Attach measured render times and underrun results from the representative workload. That record makes later changes to fonts, animations, resolution, or memory configuration reviewable instead of speculative.
Sources and photograph
The numerical examples are calculations from stated assumptions, not measured performance claims. Controller-specific guidance is linked above.
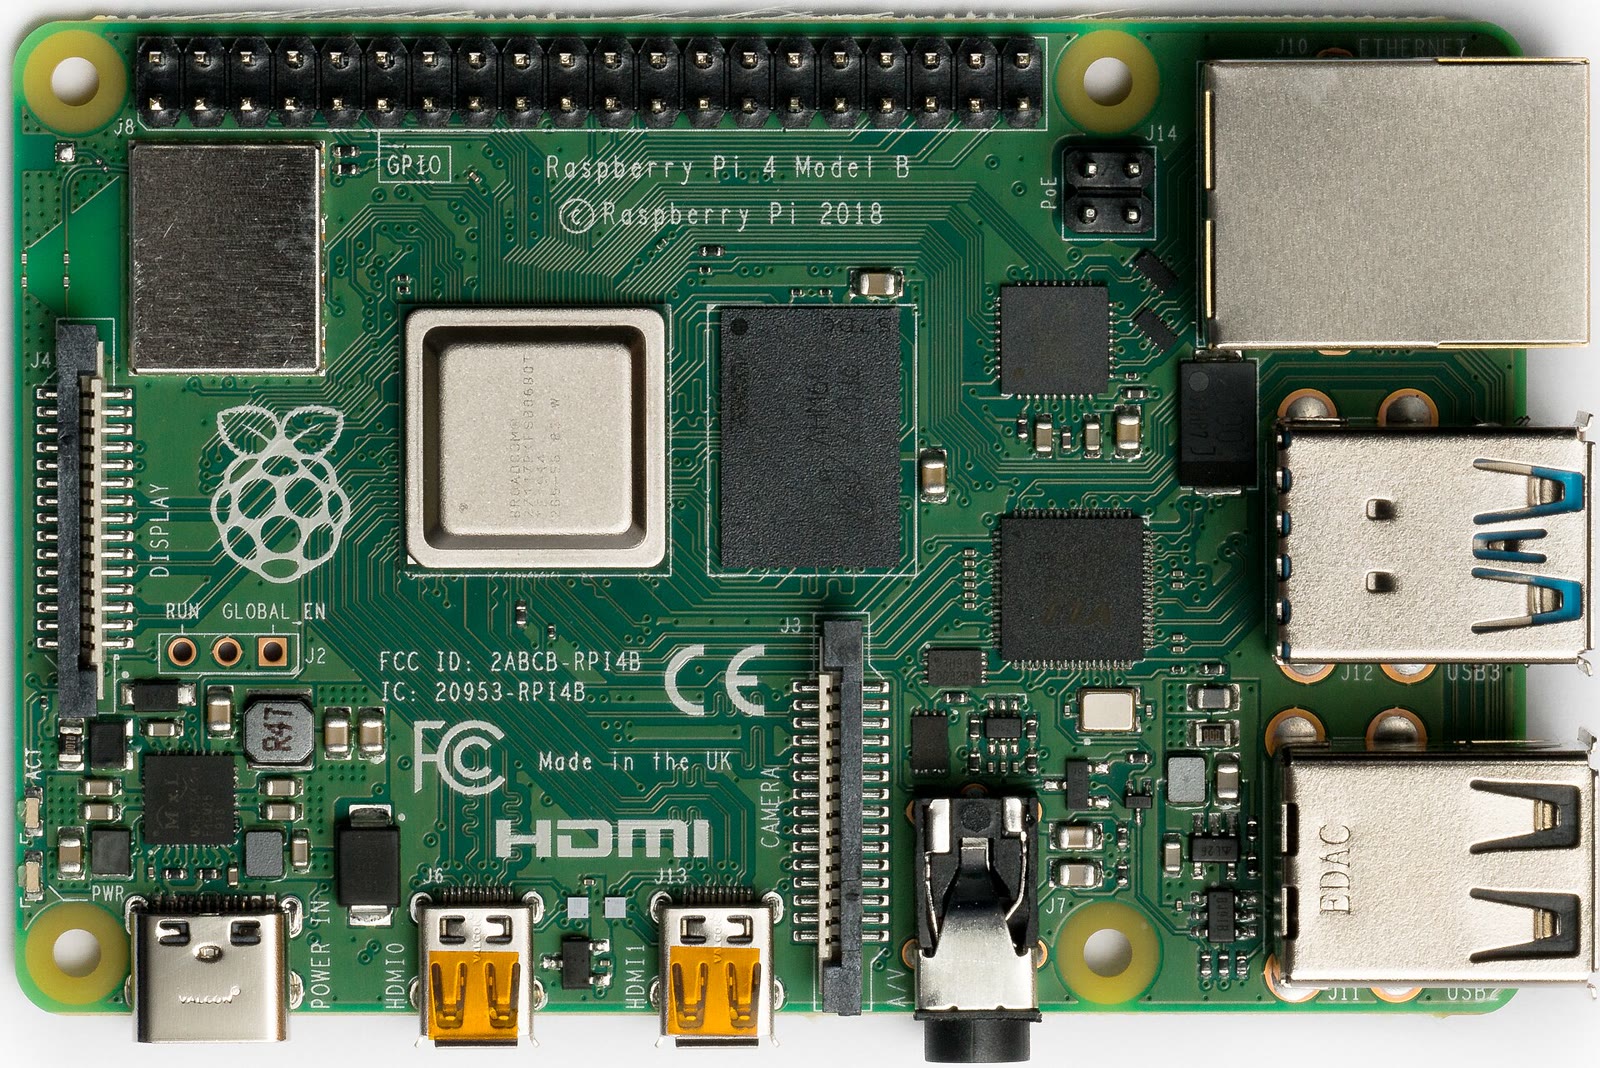
Hero photograph: Laserlicht, Raspberry Pi 4 Model B, CC BY-SA 4.0. Resized and JPEG-compressed; the adapted photograph retains that license. The memory-flow illustration is original.